• CONTACT
  • MARKETCAP
  • BLOG
Crypto NEWS
  • BOOKMARKS
  • Home
  • Shop
  • Bitcoin
  • Crypto News
  • Altcoin
  • Blockchain
  • Market Trends
  • Legal Docs
    • Contact
    • Privacy Policy
    • Terms and Conditions
    • About CryptoNewsUpdate.com
Reading: $75,500? Analyst Reveals Historical ‘Magnet’ Level
Share

Crypto NEWS

0
Font ResizerAa
  • Home
  • Shop
  • Bitcoin
  • Crypto News
  • Altcoin
  • Blockchain
  • Market Trends
  • Legal Docs
Search
  • Home
  • Shop
  • Bitcoin
  • Crypto News
  • Altcoin
  • Blockchain
  • Market Trends
  • Legal Docs
    • Contact
    • Privacy Policy
    • Terms and Conditions
    • About CryptoNewsUpdate.com
Have an existing account? Sign In
Follow US
© Crypto NEWS Update. All Rights Reserved.
Crypto NEWS > Blog > Crypto News > $75,500? Analyst Reveals Historical ‘Magnet’ Level
Crypto News

$75,500? Analyst Reveals Historical ‘Magnet’ Level

yangzeph4@gmail.com
Last updated: March 5, 2025 8:27 am
yangzeph4@gmail.com Published March 5, 2025
Share

Este artículo también está disponible en español.

An analyst has pointed out how the 50-week moving average (MA) of Bitcoin has historically acted as a sort of magnet for the asset’s price.

50-Week MA Is Currently Situated At $75,500 For Bitcoin

In a new post on X, analyst Ali Martinez has discussed about the 50-week MA of Bitcoin. An “MA” is a technical analysis indicator that calculates the average value of any asset’s price over a given period of time and as its name suggests, moves in time, updating its value according to the changes in the price itself.

Related Reading

MAs can be useful tools for studying long-term trends in an asset, as they smooth out the price curve to remove any local deviations. An MA can be taken over any window of time, but there are some particularly popular choices like the 200-day.

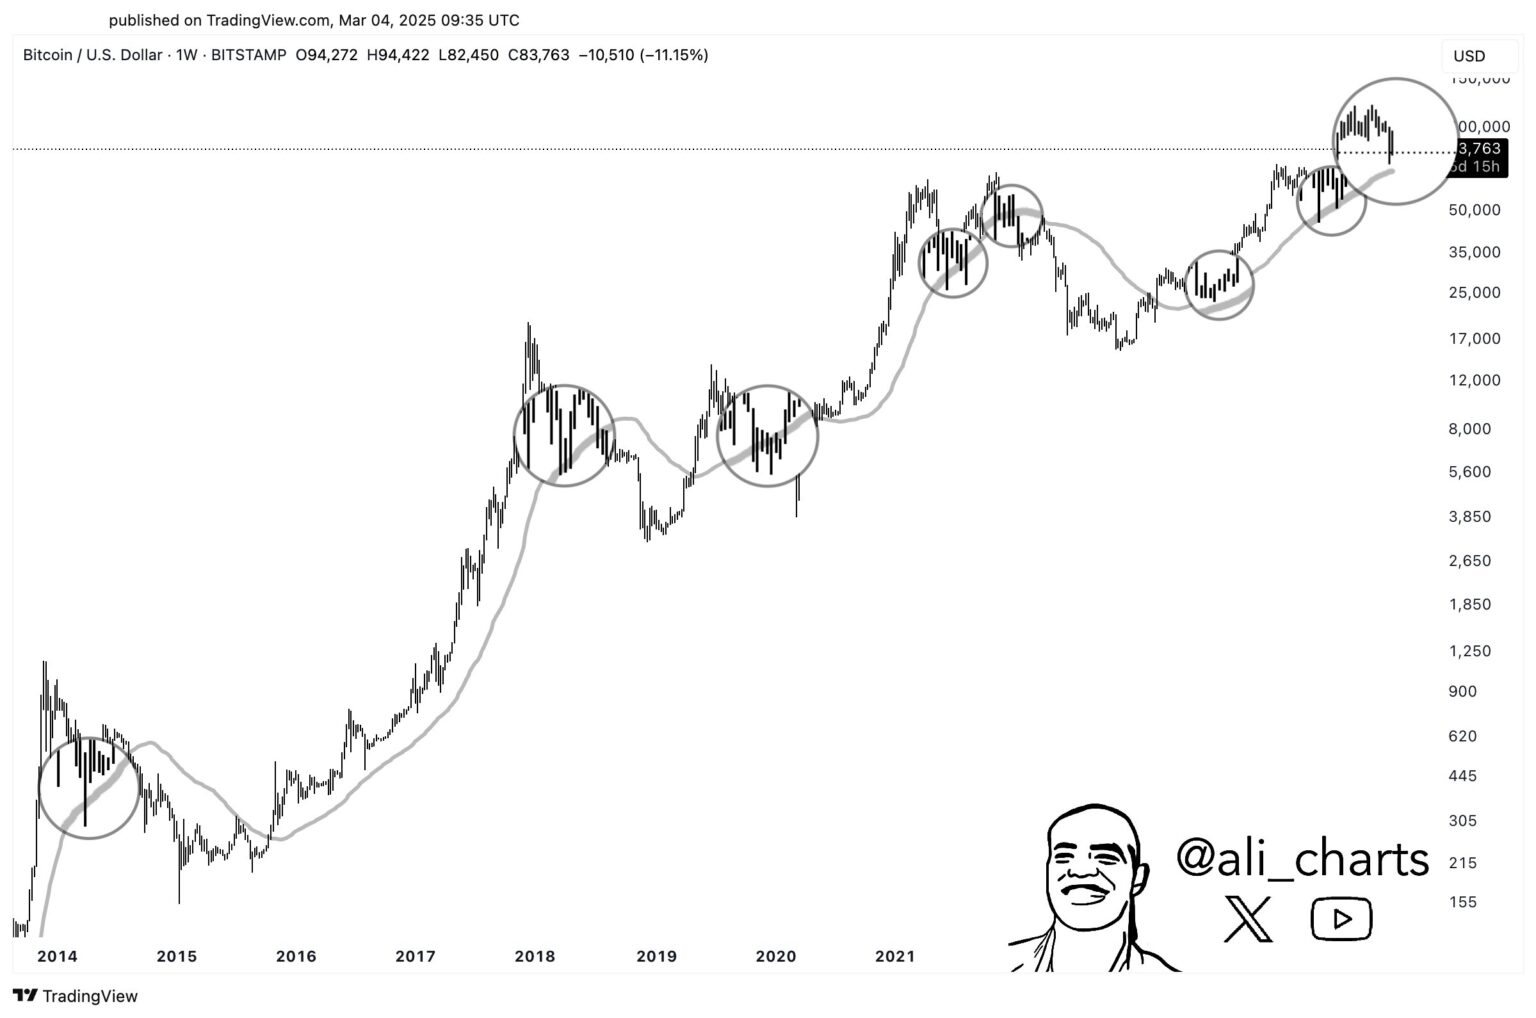
In the context of the current topic, the time-range of focus is the 50-week. Here is the chart shared by the analyst, that shows the trend in this MA for Bitcoin over the past decade or so:

Bitcoin MA
Looks like the price of the asset has been approaching this line in recent days | Source: @ali_charts on X

As is visible in the above graph, Bitcoin has been approaching this line following the latest market downturn. The asset has previously shown several retests of this level over the years.

“The 50-week moving average has historically acted as a magnet for Bitcoin $BTC during trend shifts,” explains Martinez. So far in the current cycle, the line has acted as support for the cryptocurrency, helping prevent the bull run from running out of steam.

At present, the 50-week MA is situated at $75,500. Given the current trajectory of the asset, it’s possible that a retest of the level may end up taking place once more. It only remains to be seen, though, whether the level would again provide support to Bitcoin, or if it would usher in the bear market.

In some other news, sentiment among the US investors has plummeted recently, as CryptoQuant founder and CEO Ki Young Ju has revealed in an X post.
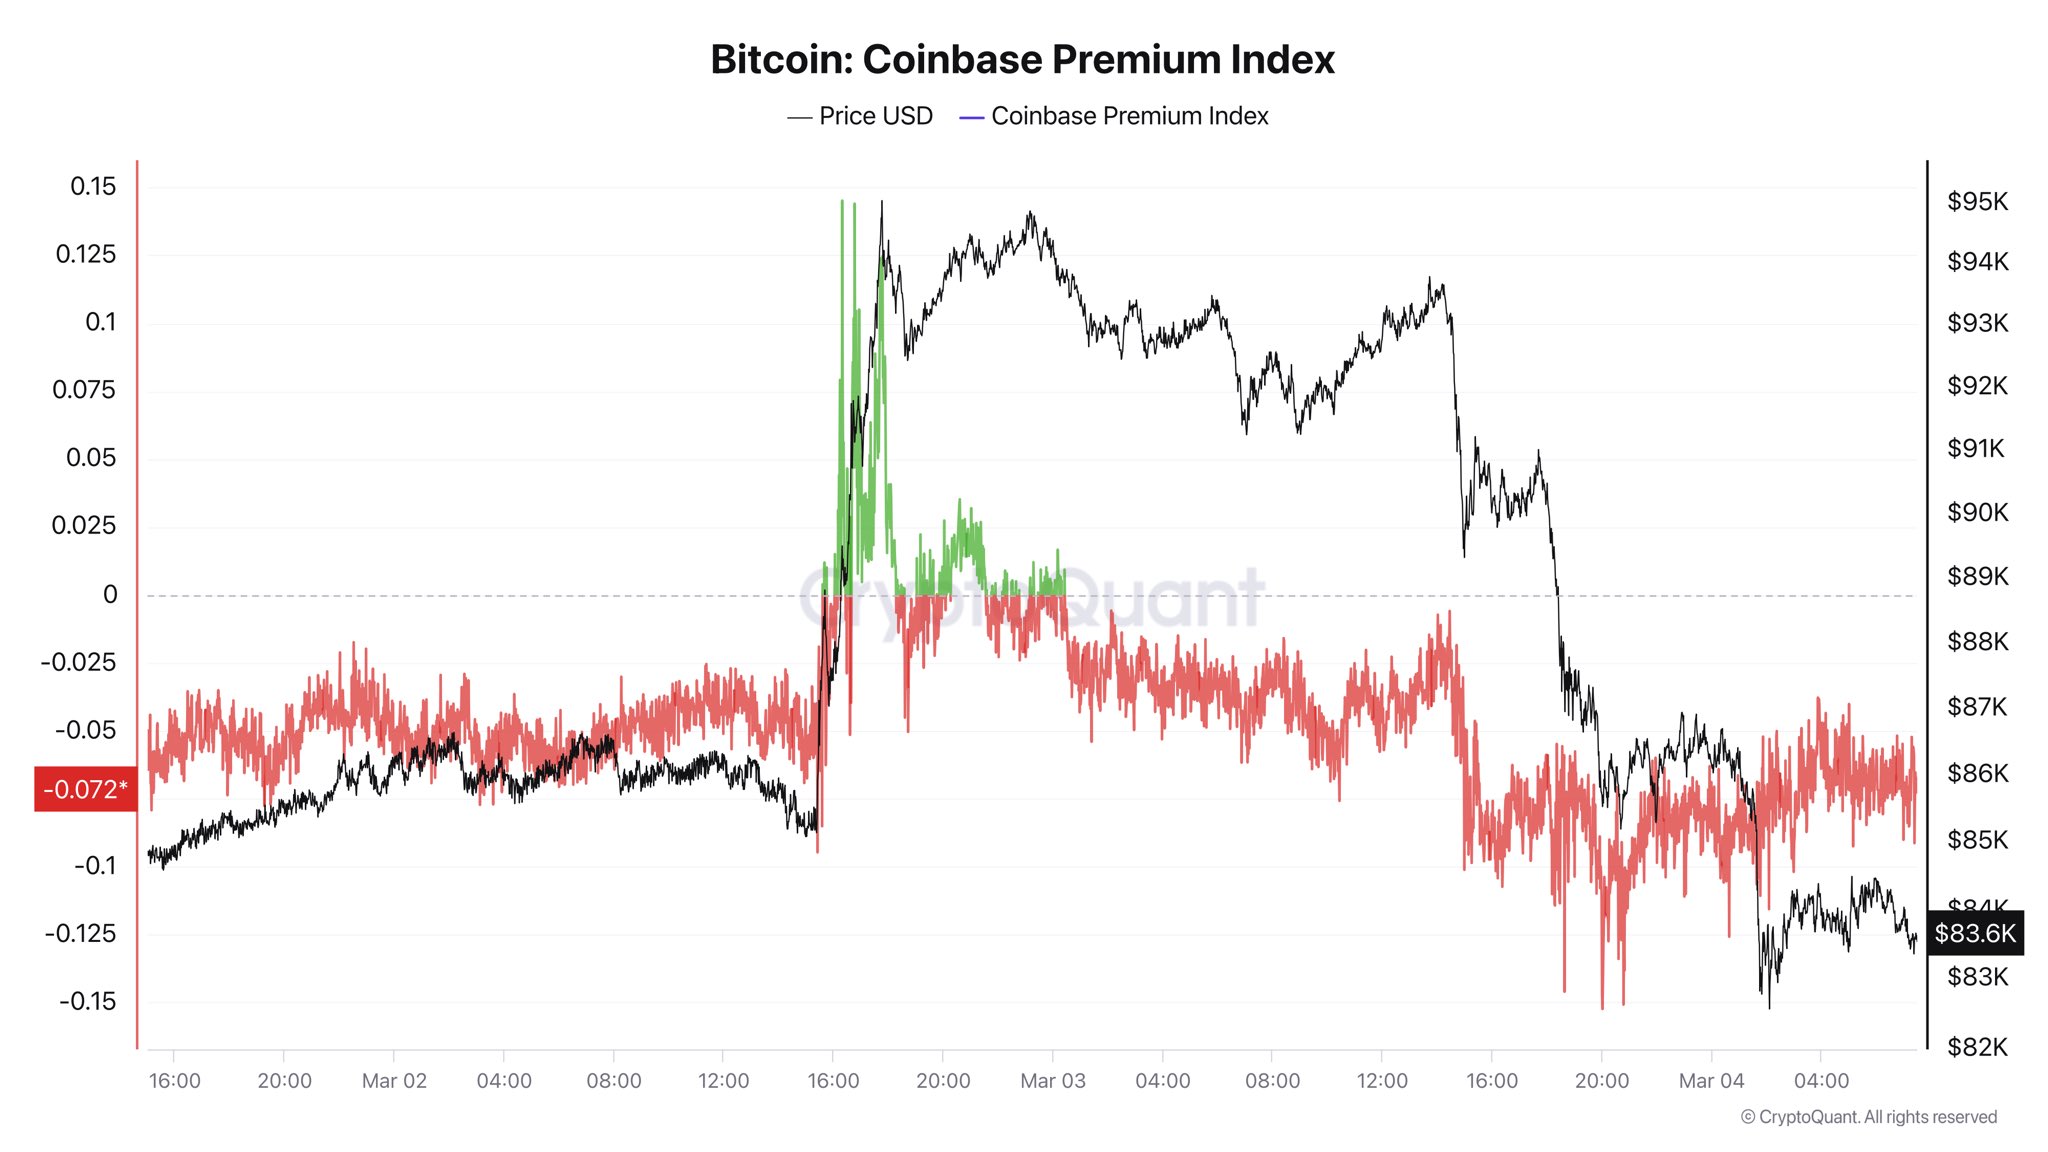
Bitcoin Coinbase Premium Index
The trend in the BTC Coinbase Premium Index over the last few days | Source: @ki_young_ju on X

In the chart, the data of the “Coinbase Premium Index” is displayed. This metric measures the difference between the Bitcoin price listed on Coinbase (USD pair) and that on Binance (USDT pair).

The former platform is mainly used by American investors, while the latter serves a global traffic, so the indicator’s value essentially tells us about how the behavior differs between the two demographics.

During the rally earlier, the Bitcoin Coinbase Premium Index spiked to a sharp positive level, suggesting the US-based whales were buying. Shortly after, though, it dipped back into the negative and has since plunged deeper into the zone, implying users on the exchange are doing some heavy distribution.

Related Reading

“Bitcoin market will likely remain slow until sentiment in the U.S. improves,” notes the CryptoQuant founder.

BTC Price

At the time of writing, Bitcoin is floating around $85,700, down more than 4% over the last 24 hours.

Bitcoin Price Chart
The price of the coin appears to have already retraced its latest rally | Source: BTCUSDT on TradingView

Featured image from Dall-E, CryptoQuant.com, chart from TradingView.com

You Might Also Like

Bitcoin Bull Market Intact As Key On-Chain Metric Points To Fresh Rally Potential

ETH/BTC Setup Could Trigger Altseason

High-Risk Crypto Perpetual Futures Could Be Coming Soon To US

The CLARITY Act Shouldn’t Be Included In The GENIUS Act Say Senator Hagerty, Analysts

Semler Declares Bitcoin Accumulation War For 105,000 BTC

Sign Up For Daily Newsletter

Be keep up! Get the latest breaking news delivered straight to your inbox.

By signing up, you agree to our Terms of Use and acknowledge the data practices in our Privacy Policy. You may unsubscribe at any time.
Share This Article
Facebook Twitter Email Copy Link Print
Previous Article Trump Declares an End to Biden’s Crypto Policies, Vows U.S. Leadership in Bitcoin
Next Article Tether USDt custody and transfers ‘not restricted’ under MiCA — ESMA
Leave a comment

Leave a Reply Cancel reply

Your email address will not be published. Required fields are marked *

Follow US

Find US on Socials

Subscribe to our newslettern

Get Newest Articles Instantly!

Popular News
Uber Expands AI Push After Meta’s Scale AI Investment
Blocktech Brew Join Hands With Qila To Promote Web3 Services Across Industries!
$150M money market funds added to Arbitrum’s RWA ecosystem

Follow Us on Socials

We use social media to react to breaking news, update supporters and share information

Twitter Youtube Telegram Linkedin
Crypto NEWS

We influence 20 million users and is the number one business blockchain and crypto news network on the planet.

Subscribe to our newsletter

You can be the first to find out the latest news and tips about trading, markets...

Ad image
© Crypto NEWS Update. All Rights Reserved.
Welcome Back!

Sign in to your account

Lost your password?