


Reason to trust
![]()
Strict editorial policy that focuses on accuracy, relevance, and impartiality
Created by industry experts and meticulously reviewed
The highest standards in reporting and publishing
Strict editorial policy that focuses on accuracy, relevance, and impartiality
Morbi pretium leo et nisl aliquam mollis. Quisque arcu lorem, ultricies quis pellentesque nec, ullamcorper eu odio.
Brewing tensions between Israel and Iran have triggered global de-risking across risk-on assets, including Bitcoin (BTC). The top cryptocurrency by market cap is down 1.7% over the past 24 hours. That said, technical indicators still point toward a potential new all-time high (ATH) for BTC in the coming months.
Bitcoin Tracing The ABCD Pattern
According to a recent post on X by crypto analyst Titan of Crypto, BTC appears to be following the ABCD pattern. The analyst noted that Bitcoin is currently trading within a wedge formation and could target as high as $137,000 if it breaks out.
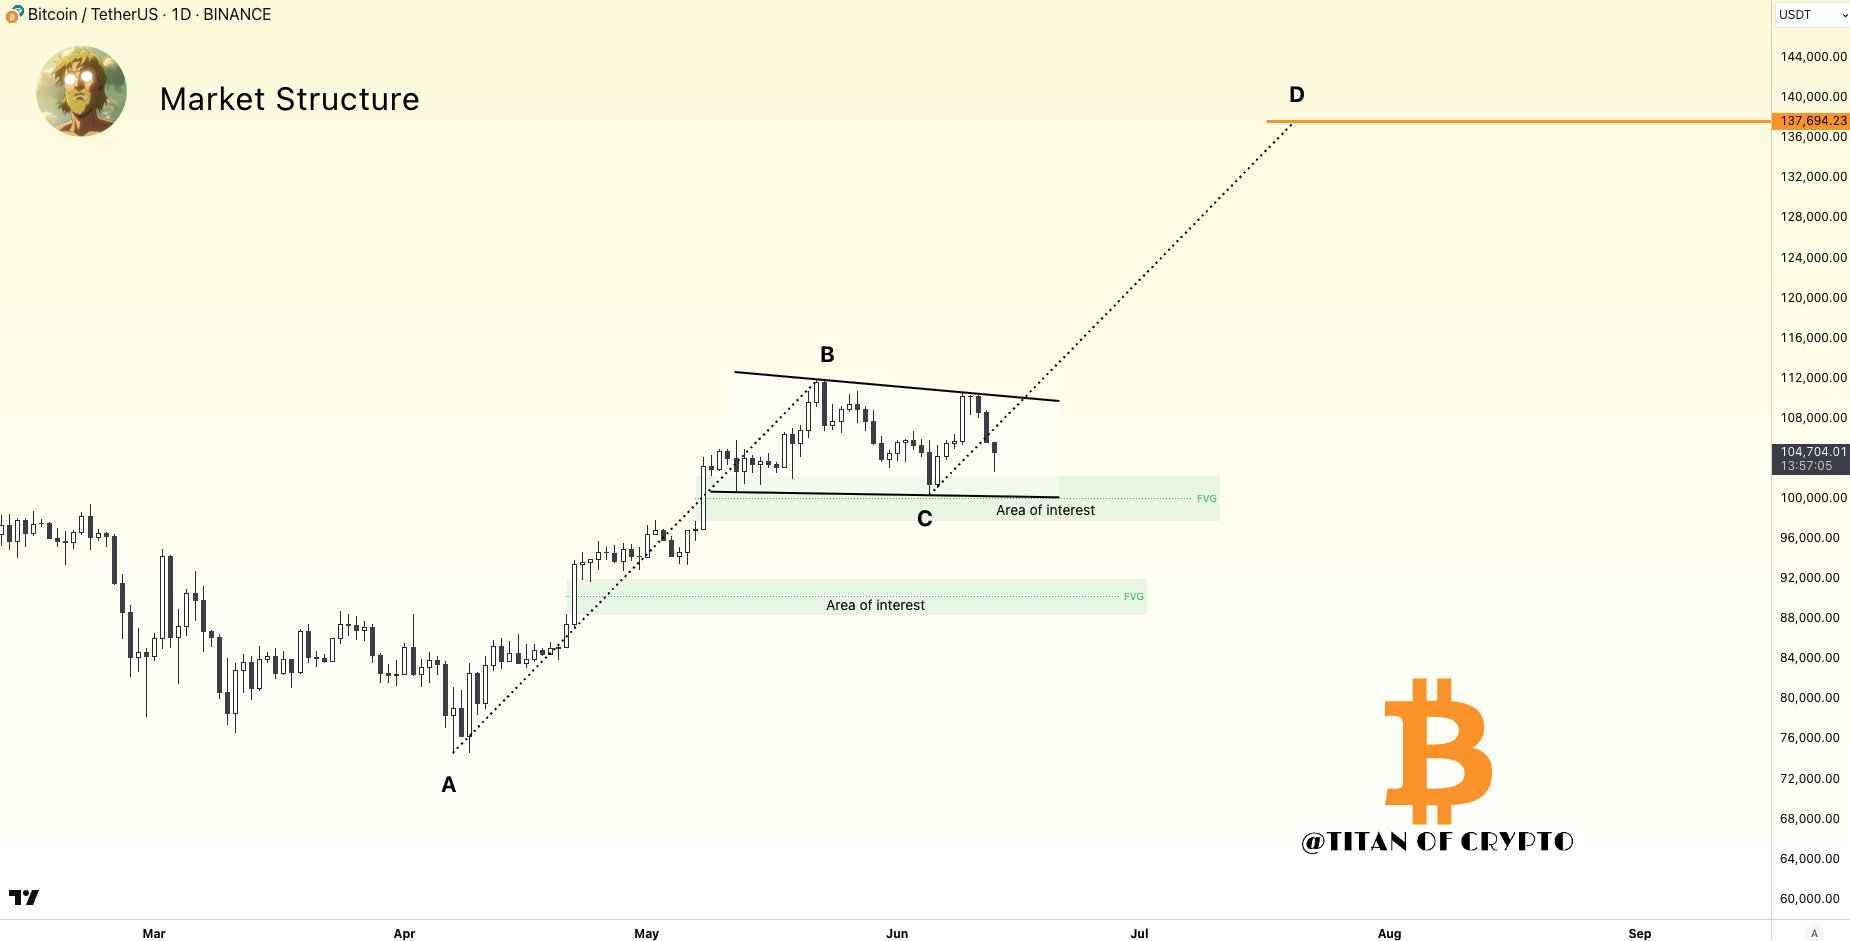
For the uninitiated, the ABCD pattern is a classic chart setup with four points and three legs – AB, BC, and CD – where AB and CD are typically equal in length, and BC serves as the retracement. It helps identify potential reversal zones and signals when a price move may be losing momentum.
Related Reading
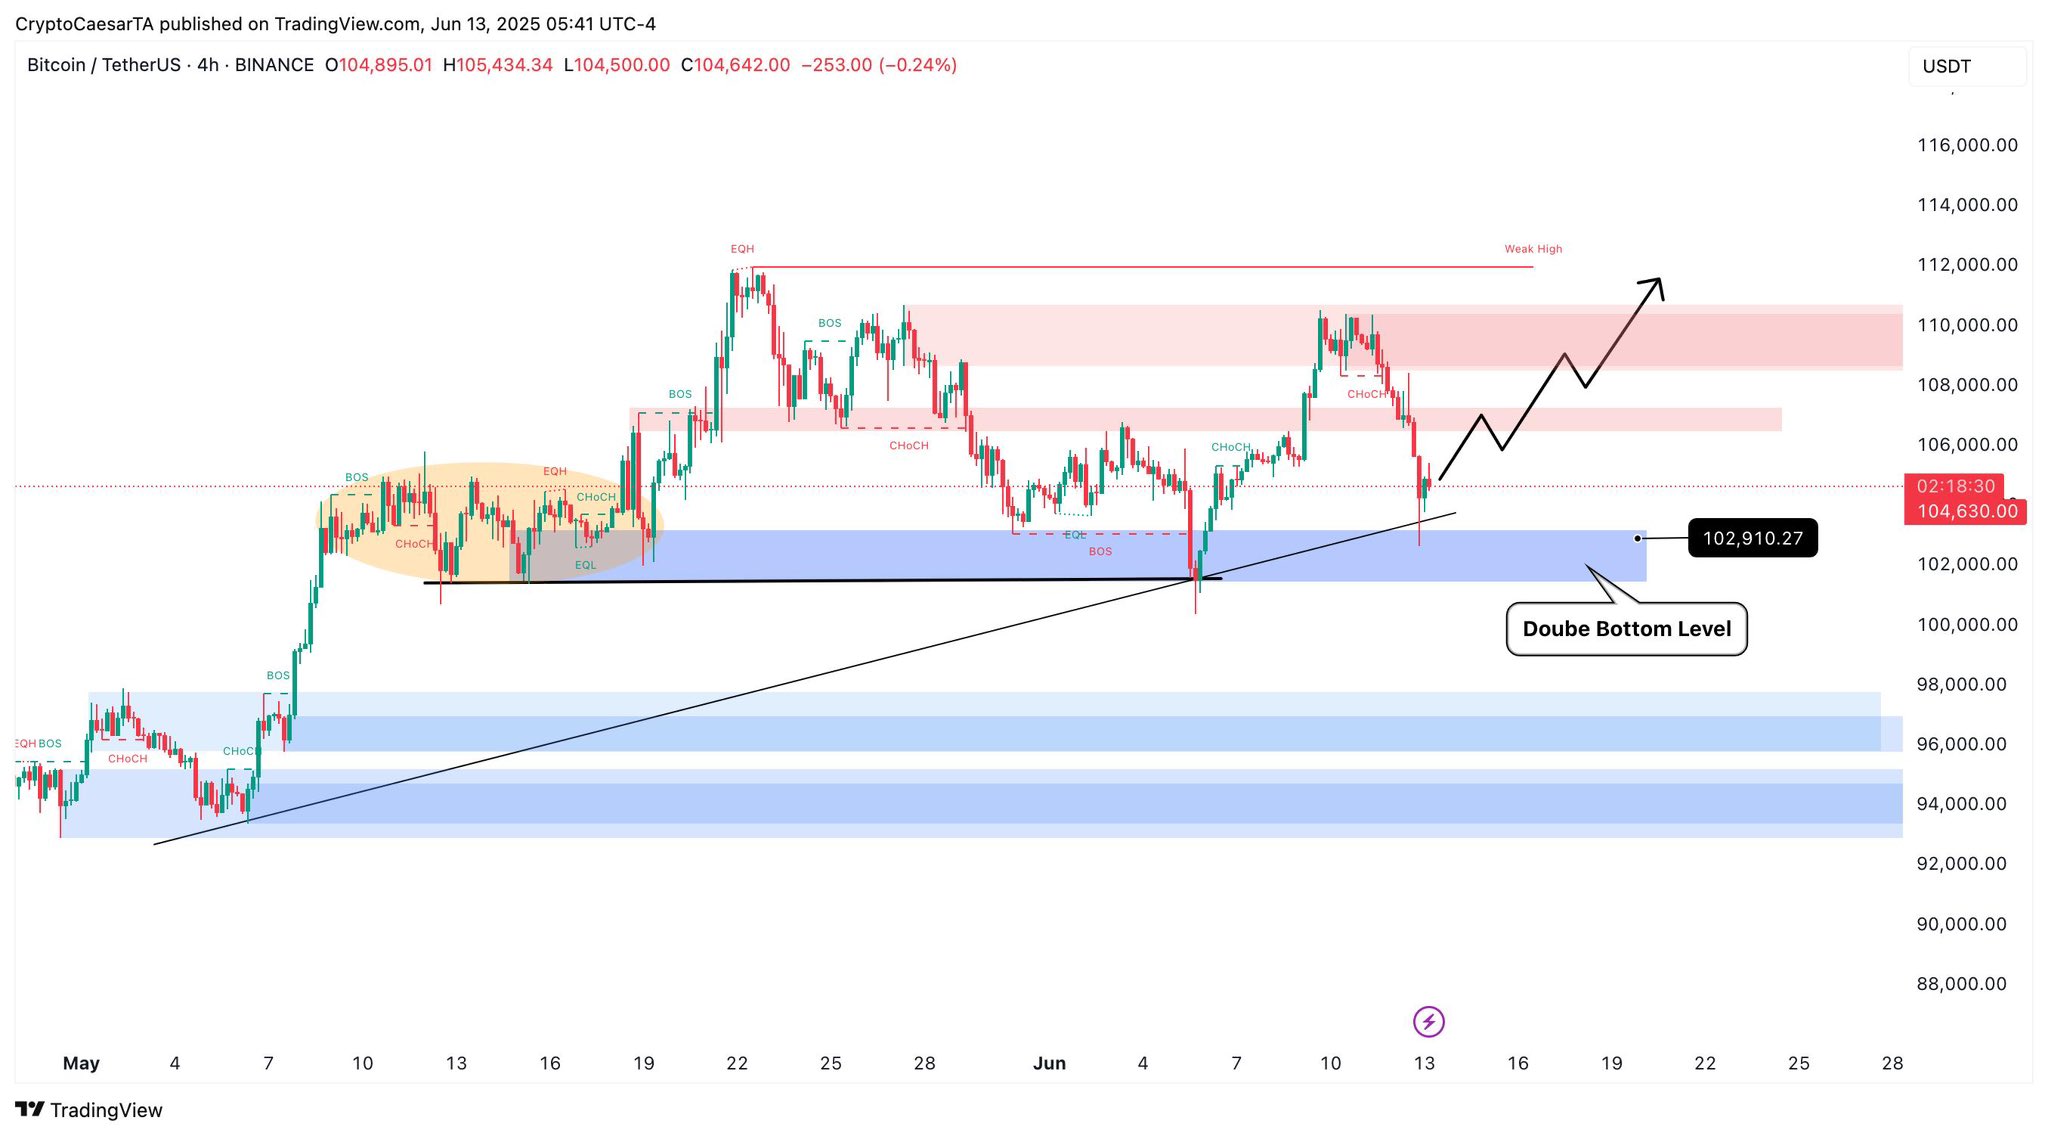
Several other technical indicators also point to a potential new ATH for BTC. For instance, crypto analyst Crypto Caesar shared the following 4-hour Bitcoin chart highlighting a bullish double bottom pattern that suggests BTC is primed for recovery.
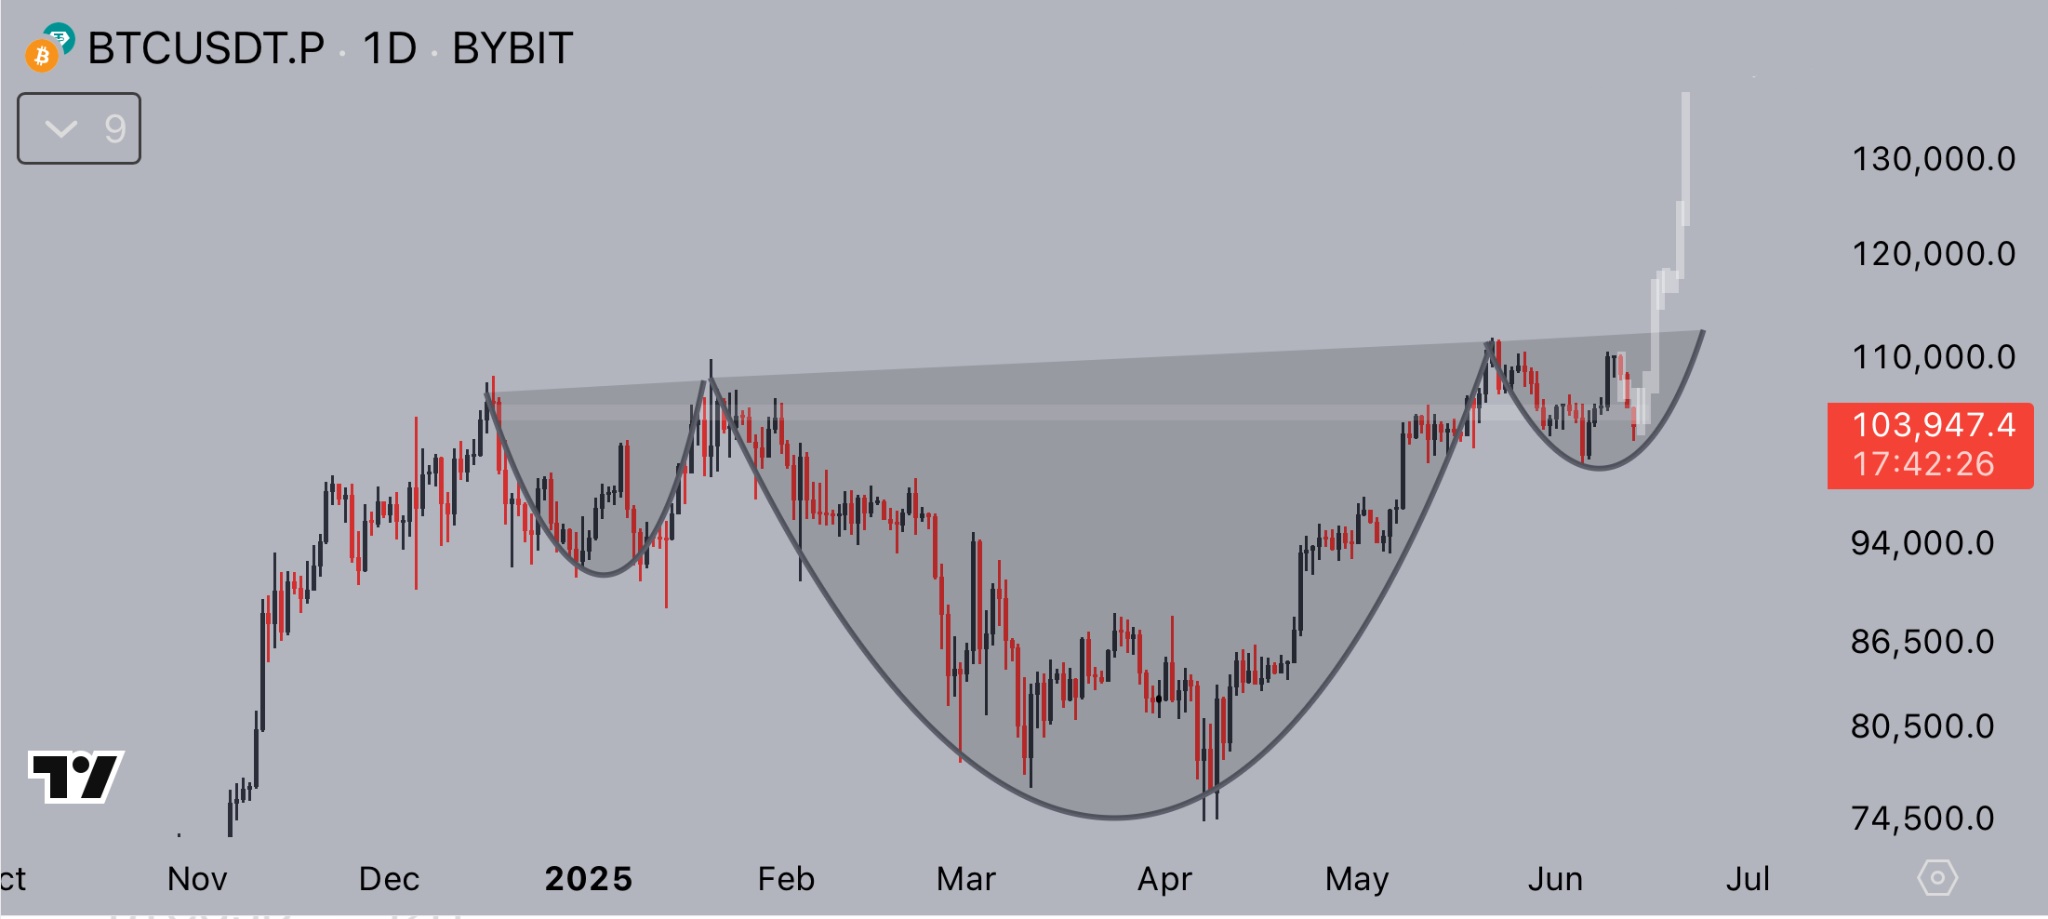
Fellow crypto commentator Jelle identified a cup and handle pattern on the daily BTC chart. Jelle shared the following chart showing that BTC has already formed the “cup” and is now beginning to shape the “handle,” which typically precedes a sharp upward move.
Meanwhile, crypto trader Merlijn the Trader pointed to the Hash Ribbons – an on-chain indicator historically associated with major rallies. Merlijn shared the following BTC daily chart, noting that the last four appearances of this signal preceded strong Bitcoin uptrends.

To explain, Hash Ribbons is an on-chain indicator that uses Bitcoin’s 30-day and 60-day hash rate moving averages (MA) to spot miner capitulation and recovery. A bullish signal appears when the short-term average crosses above the long-term one.
Are BTC Bears Regaining Ground?
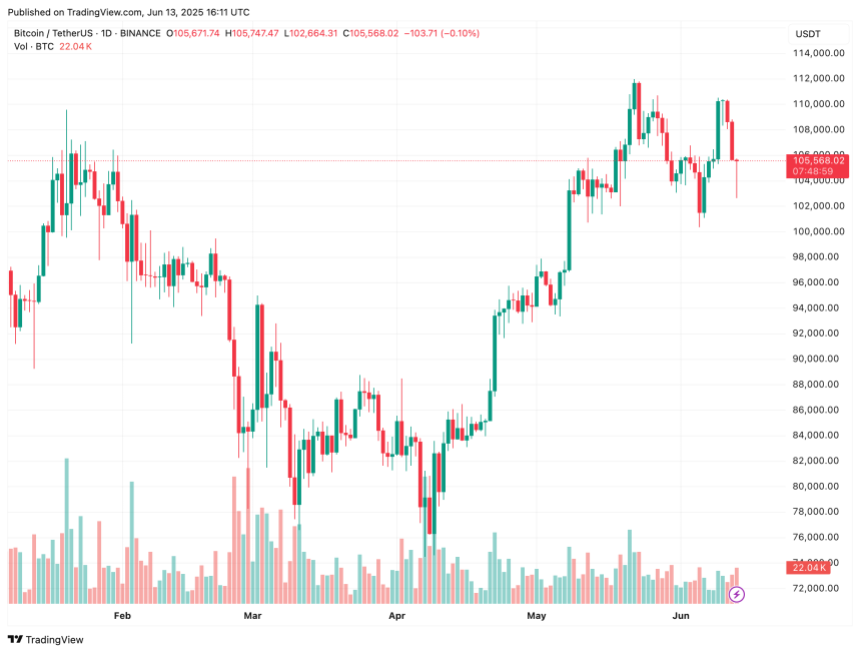
Although BTC remains above the psychologically important $100,000 mark, some concerning signs are beginning to emerge. The cryptocurrency was recently rejected from the $110,000 resistance level again, giving bears temporary control.
Related Reading
Similarly, on-chain data shows that long-term holders are beginning to exit the Bitcoin market which retail investors are starting to join in. Such dynamics are typically observed during the late phase of a bull cycle.
In parallel, short-term holders are showing signs of declining confidence in BTC, as reflected in recent on-chain activity. At the time of writing, BTC trades at $105,568, down 1.7% over the past 24 hours.
Featured image with Unsplash, charts from X and TradingView.com