


Hyperliquid price has stood in the background on socials and news outlets lately. Is this the top for HYPE or is it accumulating for the next leg up? Technical analysis reveals key insights when it comes to price and risk. Investors might be a little on edge, as competition by Aster has been fierce lately. But which project will outlast?
Hyperliquid has consolidated in this range for over 135 days.
In that time, the assistance fund has purchased over 347m worth of HYPE.
We all know HYPE is fundamentally undervalued by at least 2x.
But I think it's undervalued even looking at short term flows.
1. There will… pic.twitter.com/zbtZS5qaBh
— arthur.hl (@ArthuronHL) October 8, 2025
One valid take on HYPE’s price is this ascending channel / consolidation. I would move the upper boundary to match all 3 higher highs, essentially making it a broadening wedge. Either way arthur has explained his take well enough.
DISCOVER: 20+ Next Crypto to Explode in 2025
Hyperliquid price: Technical Analysis Reveals Key Levels
(Source – Tradingview, HYPEUSD)
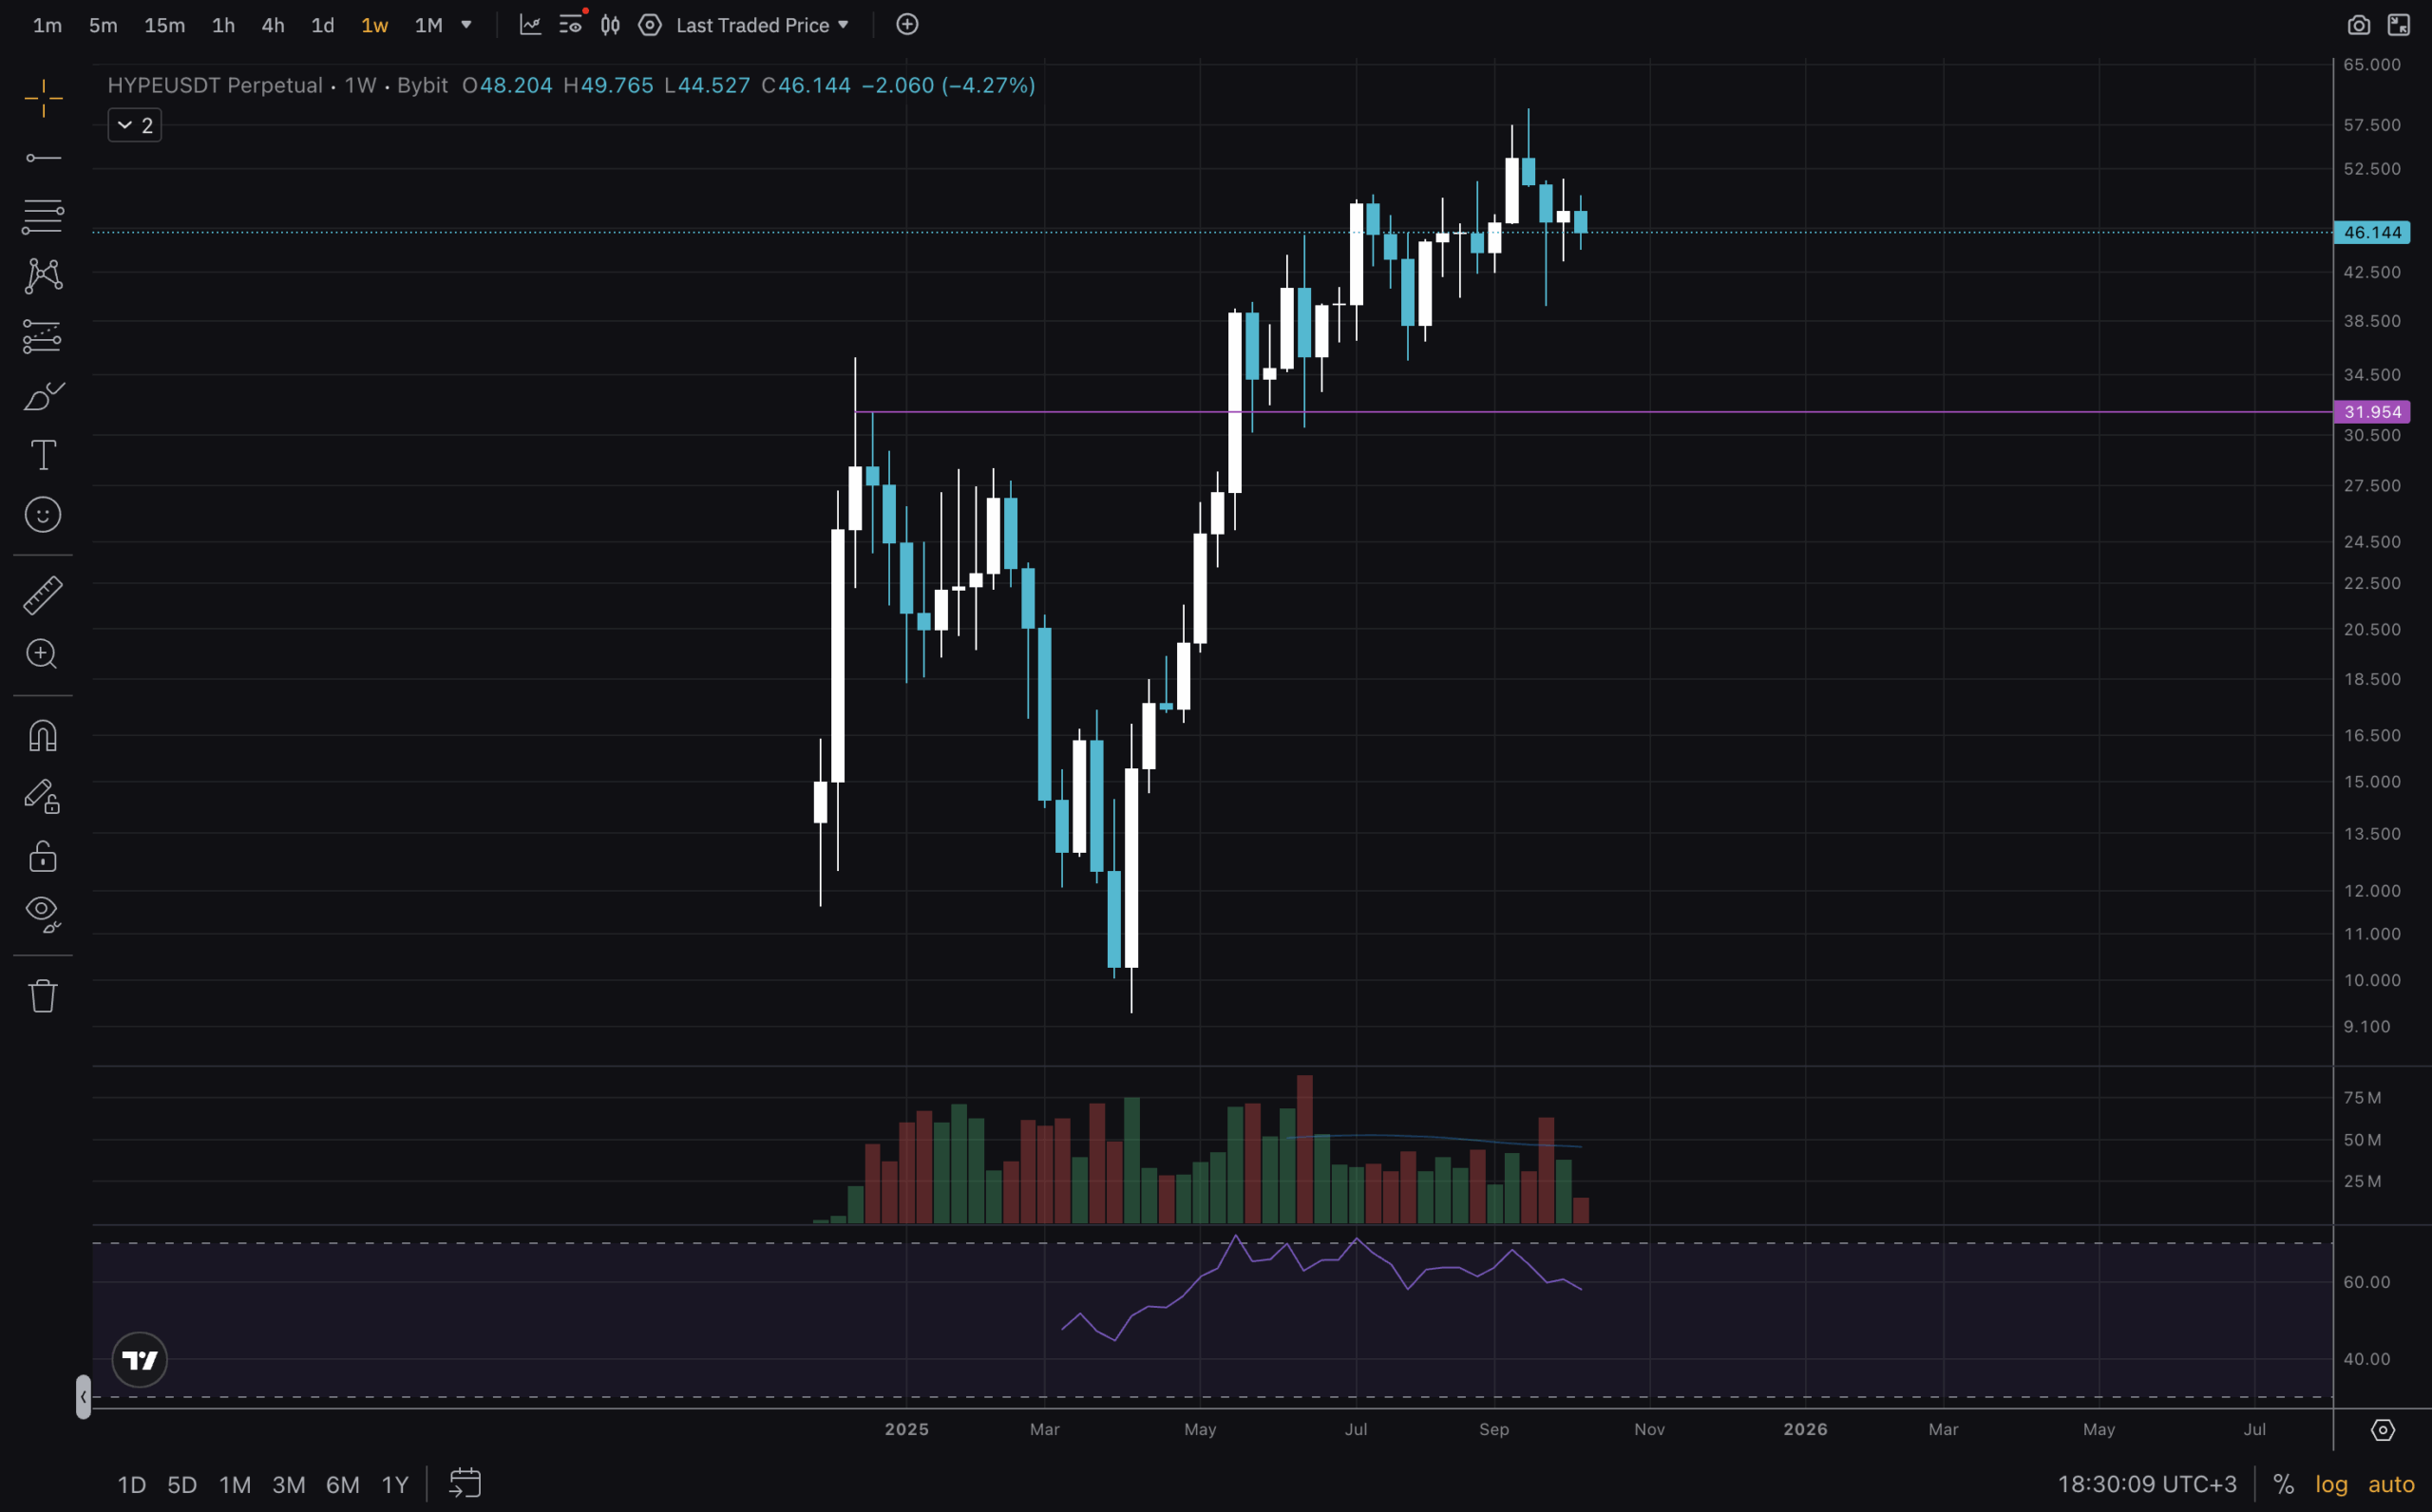
Let us begin today’s analysis with the Weekly timeframe chart. Hyperliquid is still a rather new project. Performed surprisingly well and still makes $10m-$20m revenue each week (see more in DeFi Llama). Considering it’s has a team of 4 people, these are big numbers! For this chart, we don’t have too much price history, though there is this $30-$32 level from the previous high. That is the HTF support. RSI shows a hidden bearish divergence!
DISCOVER: 9+ Best High-Risk, High-Reward Crypto to Buy in 2025
(Source – Tradingview, HYPEUSD)
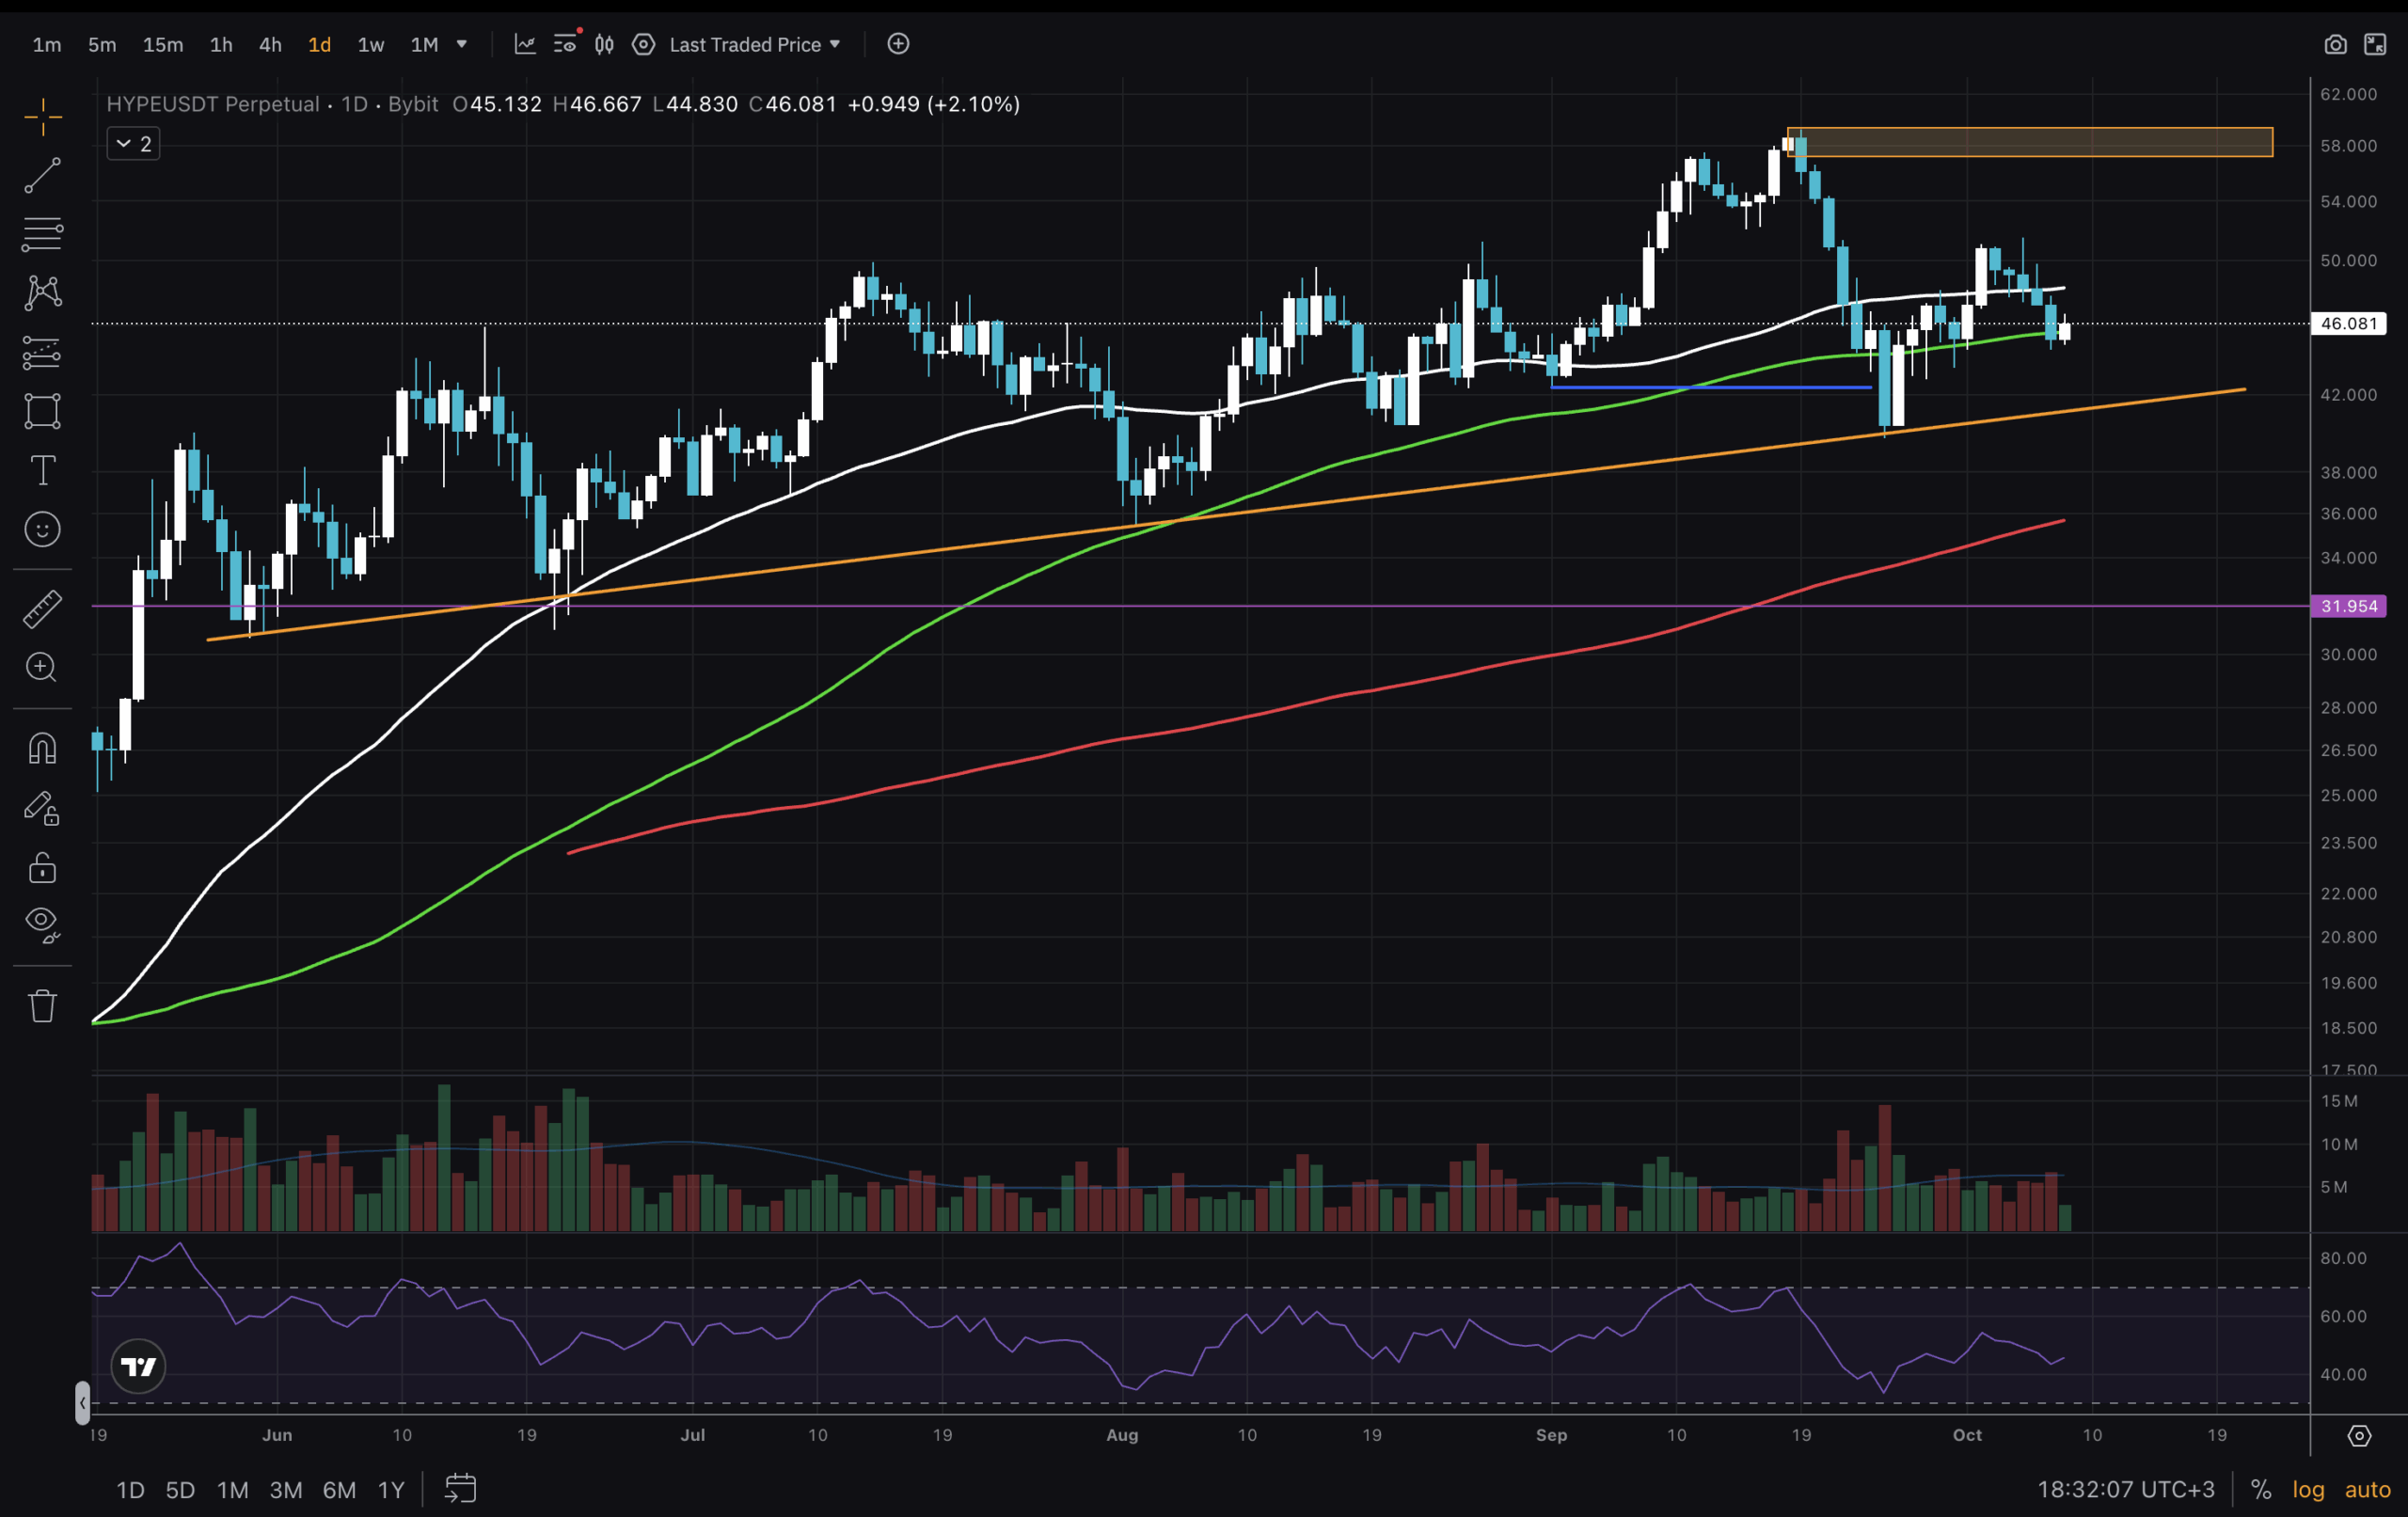
Next to look at is the 1D chart for Hyperliquid price. We have more price history to unpack here. RSI has been reset and is sitting in the bottom half of its range. Price is right around the MA100, recently broken below MA50. Looking backwards, MA50 hasn’t really been respected from August onwards. The MA’s order is still bullish, as well as market structure. We have a clear ascending support level. And with the blue line potentially showing an MSB.
DISCOVER: 9+ Best Memecoin to Buy in 2025
HYPE: Next Moves To Expect
(Source – Tradingview, HYPEUSD)
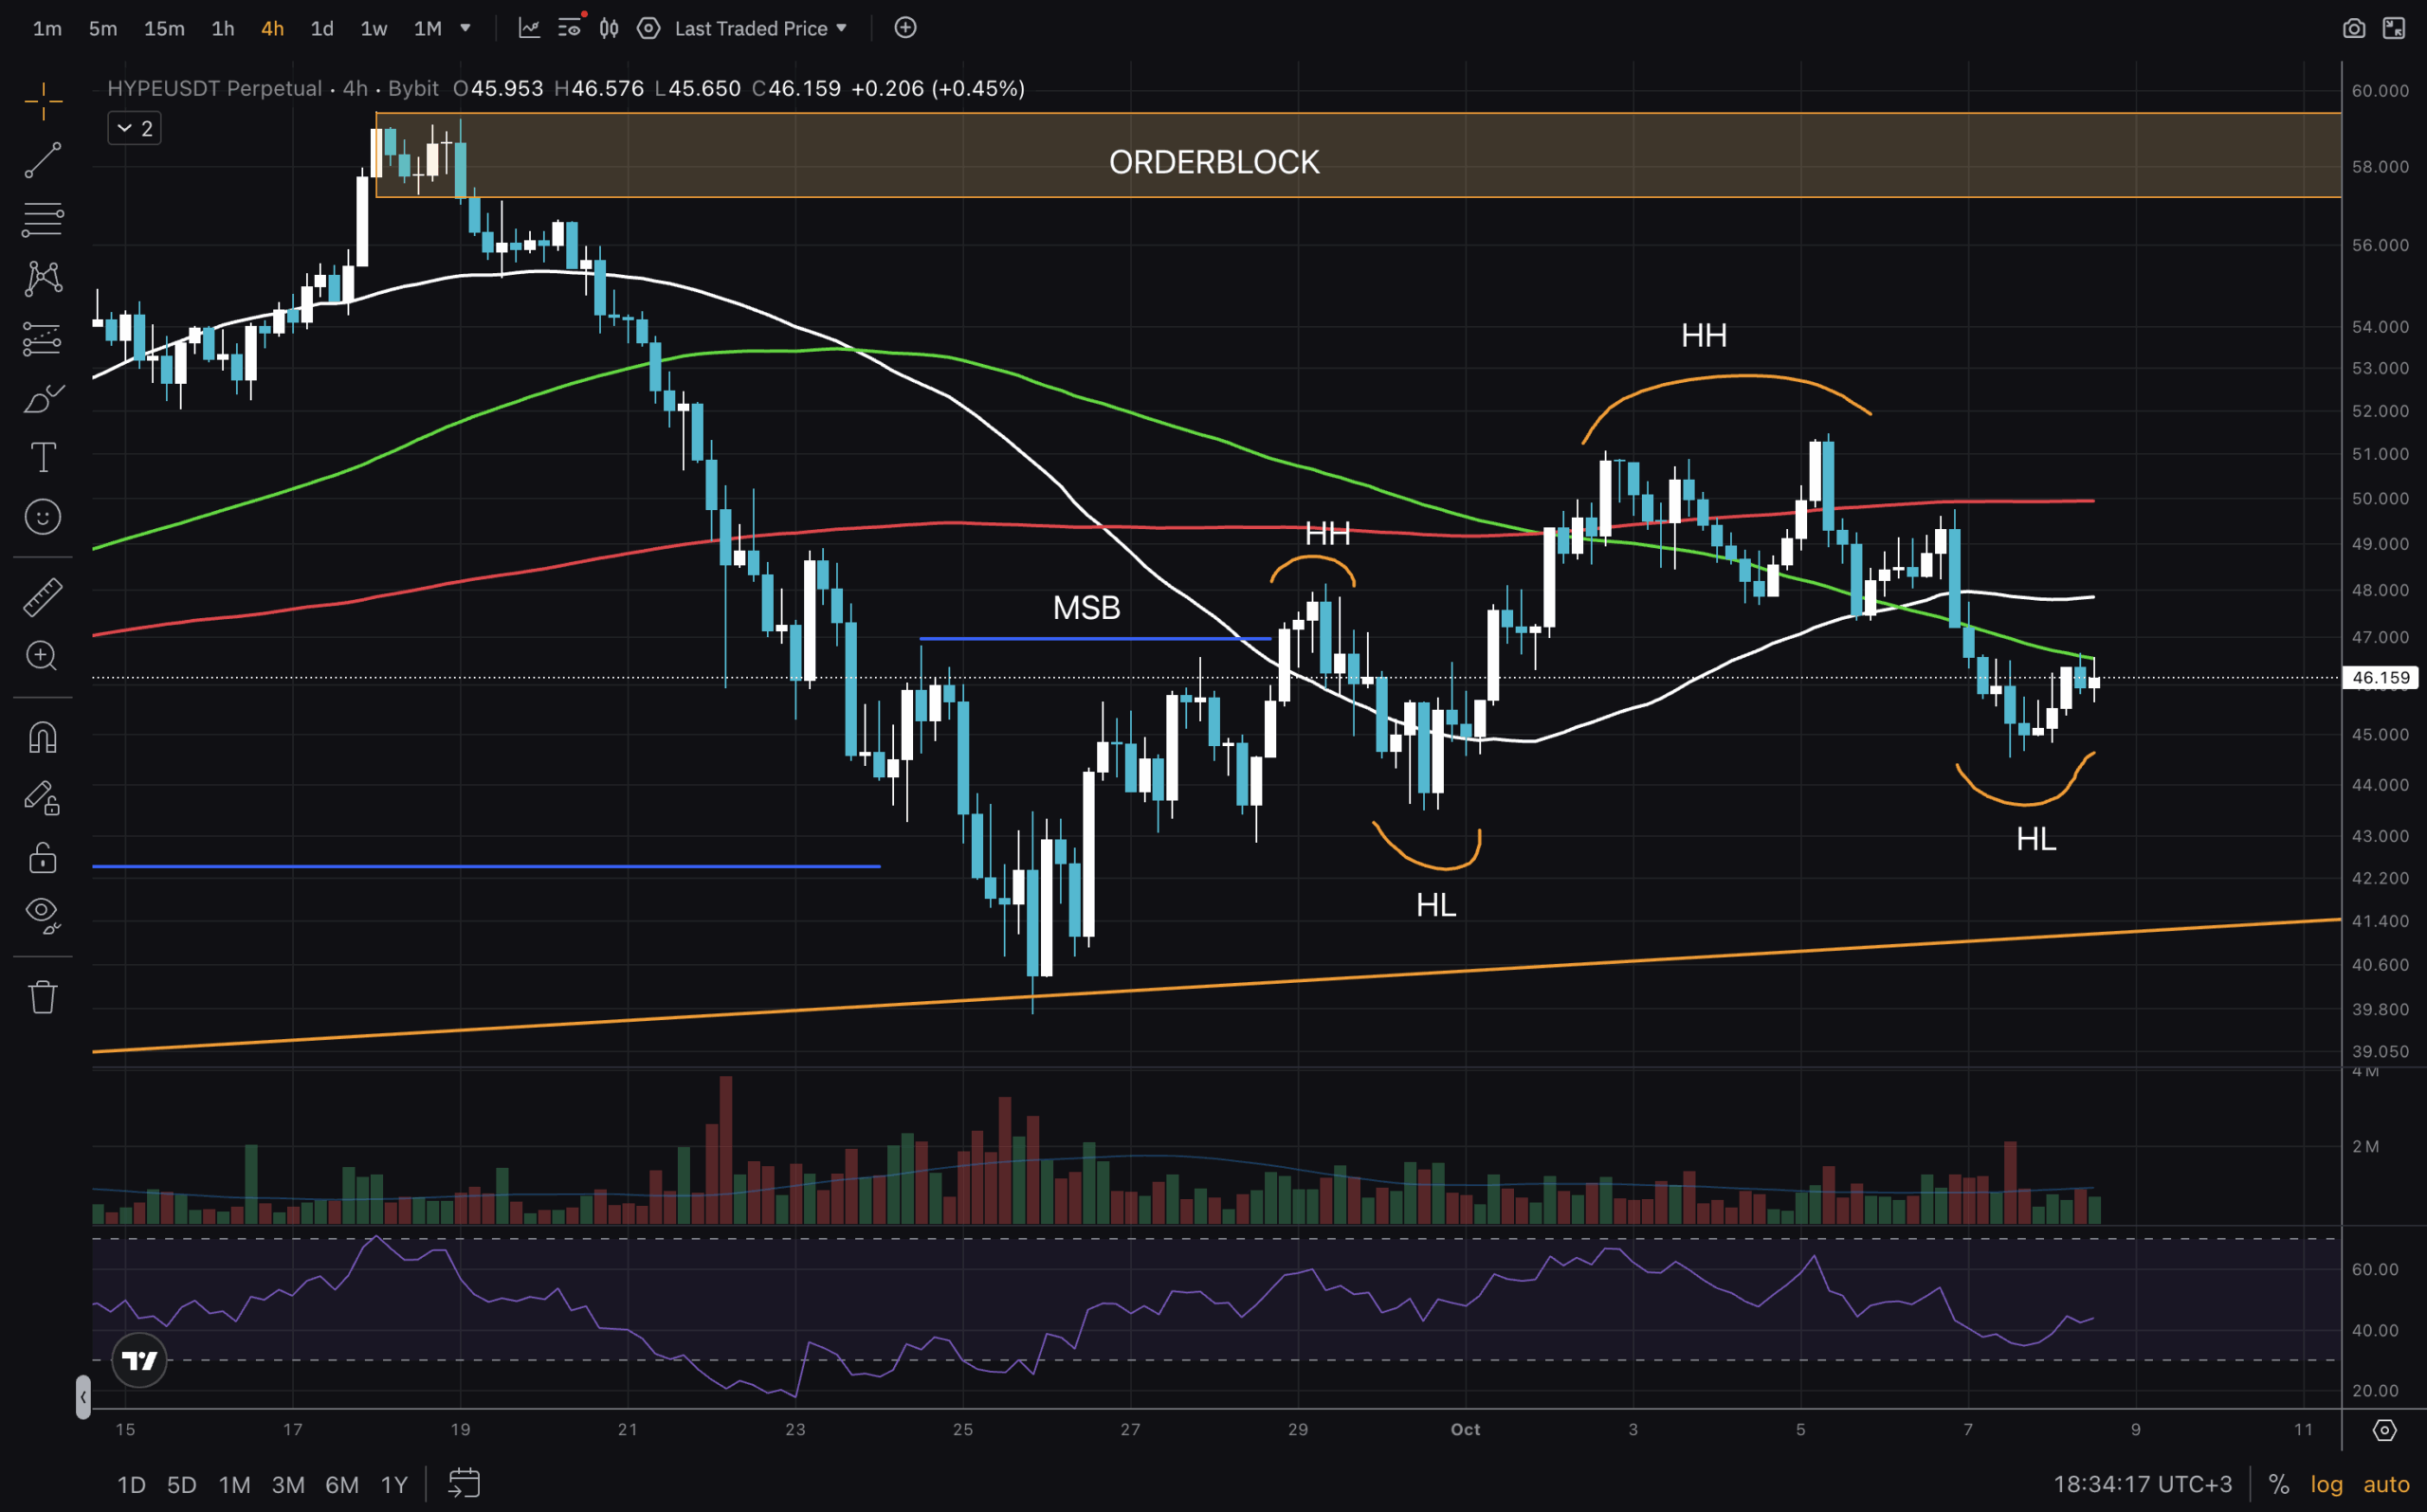
Last, we will look at the 4H chart and see what we can expect in the near future. The blue line potentially indicating an MSB on the 1D is creeping in from the left side on this timeframe. We can see that price bounced off of support with two bullish engulfing candles, indicating strength. Also, on this LTF there is an MSB followed by a pair of Higher Highs and Higher Lows. Bulls would like to see the MAs and $57-$59 order block reclaimed, and support around $40 to hold.
That’s it for today. Stay safe out there!
DISCOVER: 16+ New and Upcoming Binance Listings in 2025
Join The 99Bitcoins News Discord Here For The Latest Market Update
Hyperliquid Stands Still In The $40s: Is This A Quiet Accumulation Or A Distribution?
- Hyperliquid Price is ranging in the $40-$55 range for more than a month.
- RSI on 1W has hidden bearish divergence
- Bearish Orderblock between $57-$59 needs to be broken
- A break on either side of the channel can be decisive
The post Hyperliquid Stands Still In The $40s: Is This A Quiet Accumulation Or A Distribution? appeared first on 99Bitcoins.