

Join Our Telegram channel to stay up to date on breaking news coverage
The XRP price dropped 4% in the past 24 hours to trade at $2.856 as of 3:37 a.m. EST even as trading volume rose 12% to $2 billion.
This comes as veteran trader Peter Brandt, with 810k followers on X, said he sees the altcoin plummeting to $2.22163 if it closes below $2.68743.
Brandt’s analysis is based on a descending triangle, which has been forming over time for the XRP price.

In support of the bearish outlook, another market veteran, Ali Martinez, also predicted that XRP could see further lows. He shared a descending triangle pattern on the daily timeframe with a similar origin as Brandt’s.
According to Martinez’s analysis, XRP could simply retest the bottom of the triangle at $2.72. His chart further highlights a possible consolidation within the triangle, which will possibly fill the remaining spaces before XRP makes its next breakout.
It looks like $XRP is heading for a retest of the triangle’s bottom at $2.72. pic.twitter.com/pBGmJR7S12
— Ali (@ali_charts) October 7, 2025
Amid the bearish stance by the two traders, Professor Astrones, a widely followed trader in the crypto community, has called the setup “pumpy.”
Can the price of XRP hold the support to soar above the triangle, or will it plunge even further?
XRP Price At A Crossroads: Can Bulls Defend The Key Support Zone?
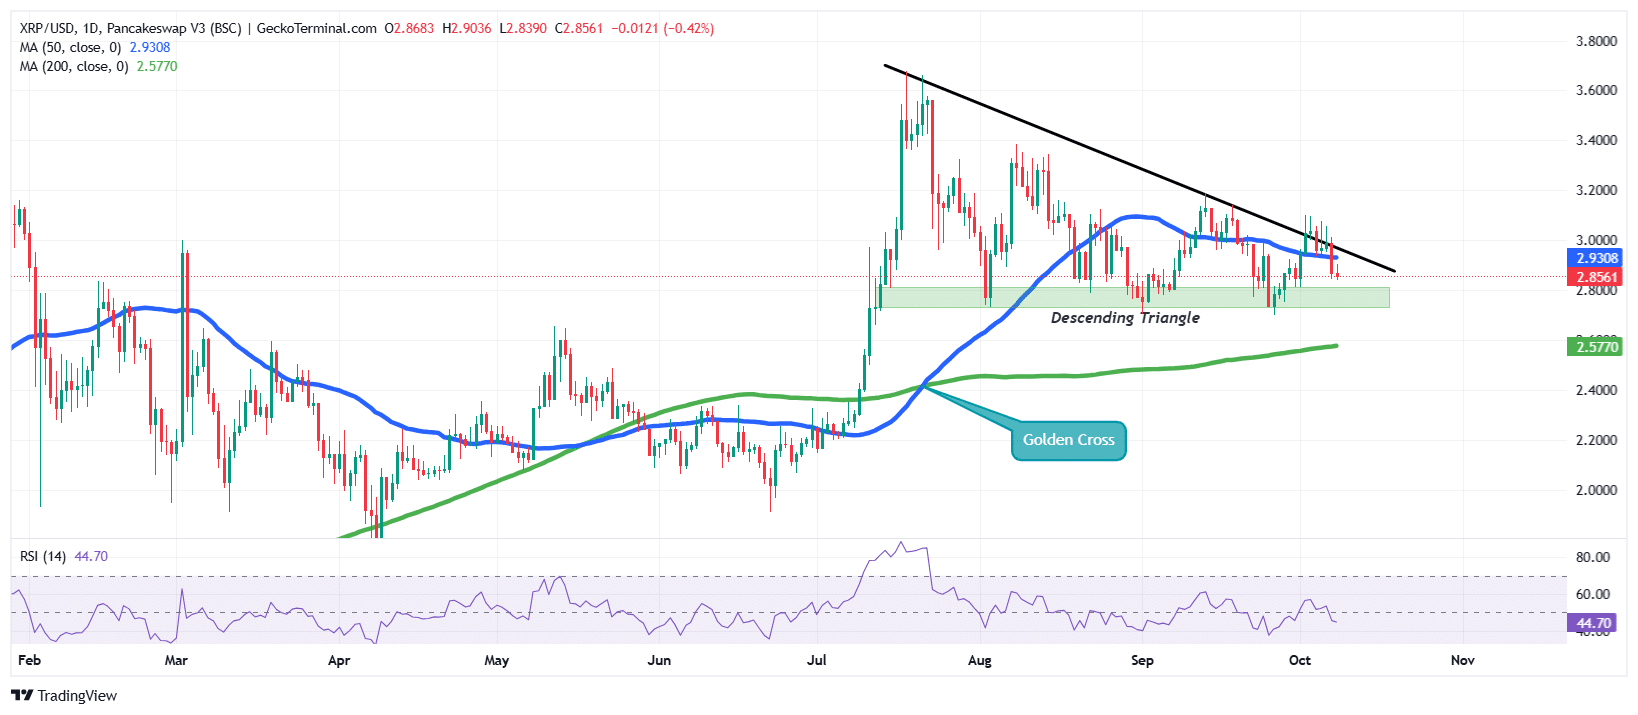
The XRP price on the daily chart shows that the Ripple token is currently in a delicate phase, moving within a descending triangle pattern that has been forming over the past few months.
This setup, defined by lower highs and a relatively flat support level around the $2.80–$2.85 region, signals a bearish continuation pattern if the lower boundary fails to hold.
Ripple token price action shows repeated rejections at the descending trendline, which clearly shows that sellers have been active on this level near the upper resistance around $3.00–$3.10. Despite brief rallies following the mid-year “Golden Cross,” XRP has struggled to maintain upward momentum, and the repeated tests of the support zone suggest growing pressure from bears.
The key zone to watch remains the shaded support area near $2.80.
Indicators Hint at a Cautious Outlook for The Ripple Token
XRP currently trades well above the 200-day Simple Moving Average (SMA), which supports the overall bullish stance. However, the 50-day SMA is now acting as the immediate resistance level at $2.93.
The Relative Strength Index (RSI) sits around 44.7, placing it in the neutral-to-slightly-bearish zone. This reading suggests that selling pressure is modest but persistent, and there’s still room for either a rebound or further decline depending on upcoming price action.
If the descending triangle resolves to the downside, XRP could fall toward the $2.60–$2.55 range, coinciding with the 200-day MA, a region that may attract dip buyers.
Conversely, a confirmed breakout above $3.00 could invalidate the bearish setup and reignite bullish momentum toward $3.40 or higher.
Related News
Best Wallet – Diversify Your Crypto Portfolio

- Easy to Use, Feature-Driven Crypto Wallet
- Get Early Access to Upcoming Token ICOs
- Multi-Chain, Multi-Wallet, Non-Custodial
- Now On App Store, Google Play
- Stake To Earn Native Token $BEST
- 250,000+ Monthly Active Users
Join Our Telegram channel to stay up to date on breaking news coverage